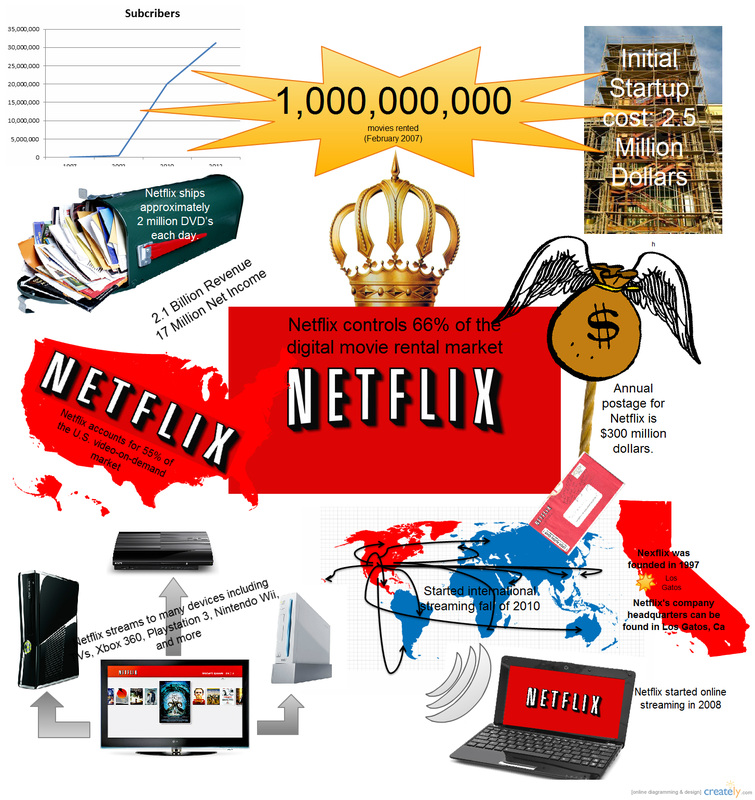
Info Graphic: NetflixThe name of the tool that my partner, Donny, and I used is called creatly. We choose to use this article because of the large amount of features and creativity that this tool allowed us to use; we had the choice of choosing from a pre-made template, or starting from a blank page and working your way towards perfection. The process that we took to make our info graphic was a long and lengthy process. First, we had to acquire the information to put on our info graphic and accumulated them into one document. Next I worked down the line picking pictures that I thought would best represent each fact well; in some cases I had to make the pictures myself, either combining, cutting, or putting together shapes. In the end I had a bunch of depictions of each fact, so next I arranged them in a way that flowed well together and mad it so that none of the pictures would overlap each other, creating delicately balanced layers of awesomeness’s that became the core of our info graphic. After that I added text for the facts and then angled them to match their pictures leaving us with a beautiful representation of Netflix that does the popular DVD rental/streaming company justice. The only real trouble that we had in creating our info graphic is when we were at school; for some reason while at school all of the tools either glitches uncontrollably, ran slower than dead frog, or simply refused to work. This was extremely frustrating because it meant that all the time we had in class was unusable, in making our info graphic and we were forced to sit around and do nothing. Once I got home and worked on the info graphic however, we were able to make progress and the info graphic was finished shortly after. I would use this tool again because of the fact that it’s free, easy to deal with, and the fact that it can be used for so many different things, that it really doesn’t make sense not to use it again.
|
|
